Part 2: How to Program an ESG Knowledge Graph
Introduction
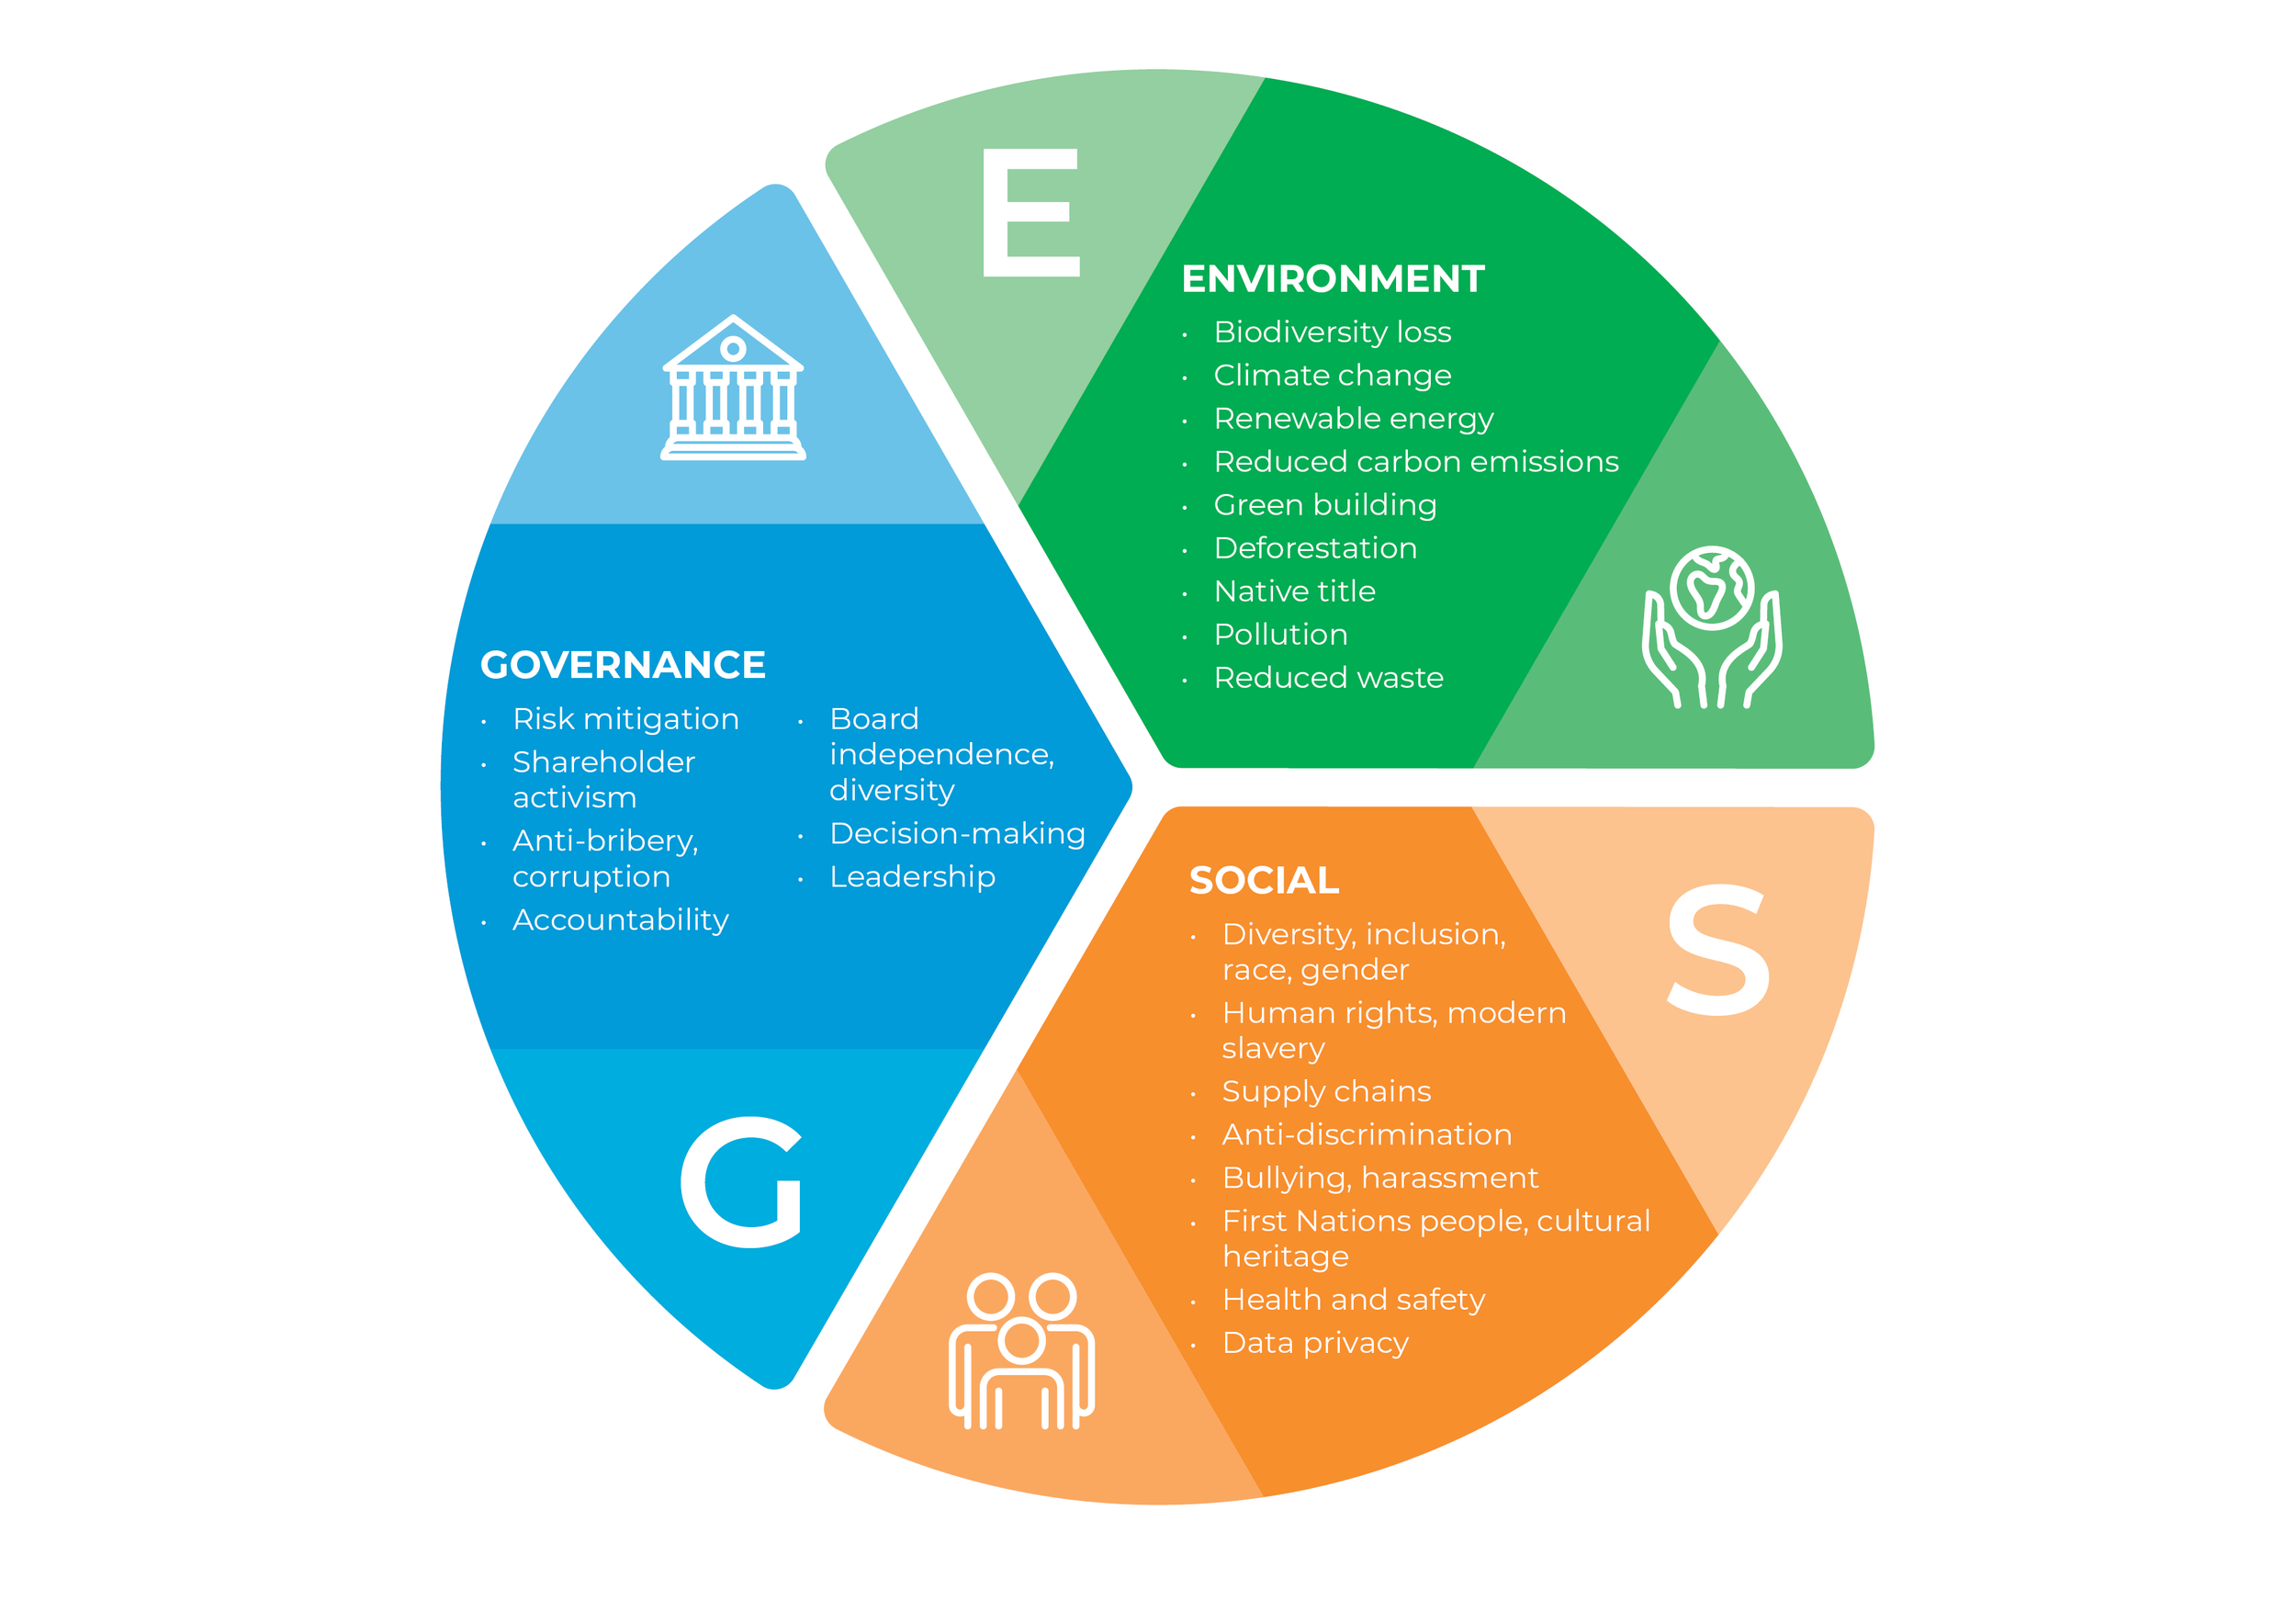
ESG is becoming the norm for most organizations. If you don’t know what it is, you can read more in our previous blog here. How do you program an ESG knowledge graph? It’s easier than you think to get started! Read below to learn:
Overview
Creating a full-fledged ESG (Environmental, Social, and Governance) knowledge graph is a complex task that requires extensive domain knowledge, data sources, and specialized tools. However, I can provide you with a simplified example of how a basic ESG knowledge graph can be represented programmatically using Python and NetworkX library. Please note that this example is for demonstration purposes only and does not encompass the full breadth and depth of an actual ESG knowledge graph.
Code, in Python:
import networkx as nx
# Create an empty knowledge graph
esg_graph = nx.DiGraph()
# Add ESG factors as nodes
esg_graph.add_node("Environmental")
esg_graph.add_node("Social")
esg_graph.add_node("Governance")
# Add relationships between ESG factors
esg_graph.add_edge("Environmental", "Governance")
esg_graph.add_edge("Social", "Governance")
# Add specific ESG metrics as nodes
esg_graph.add_node("Carbon Emissions")
esg_graph.add_node("Diversity and Inclusion")
esg_graph.add_node("Board Composition")
# Add relationships between ESG factors and metrics
esg_graph.add_edge("Environmental", "Carbon Emissions")
esg_graph.add_edge("Social", "Diversity and Inclusion")
esg_graph.add_edge("Governance", "Board Composition")
# Add additional relationships or metrics as needed
# Perform analysis on the knowledge graph
# You can use various algorithms to derive insights from the graph, such as:
# - Dependency analysis
# - Centrality analysis
# - Clustering analysis
# - Flow analysis
# - Similarity analysis
# - Pattern matching analysis
# Example: Print all nodes and their connections
for node in esg_graph.nodes:
print(f"Node: {node}")
print(f"Connections: {list(esg_graph.successors(node))}")
print("-----")
# Example: Calculate the centrality of each node
centrality = nx.eigenvector_centrality(esg_graph)
for node, centrality_score in centrality.items():
print(f"Node: {node}")
print(f"Centrality Score: {centrality_score}")
print("-----")
Finally…
In this example, we create a simple ESG knowledge graph using the NetworkX library. The graph consists of ESG factors (Environmental, Social, and Governance) as nodes, and specific ESG metrics (such as Carbon Emissions, Diversity and Inclusion, and Board Composition) as additional nodes. Relationships between the factors and metrics are represented as edges in the graph.
This basic graph structure allows you to perform various analyses and algorithms on the ESG knowledge graph, such as analyzing dependencies, calculating centrality scores, or detecting patterns.
Please note that the above code provides a starting point and can be extended and customized based on your specific ESG data and requirements.


